Aquabble - IOW (Internet of Water)
Aquabble - IOW (Internet of Water)
Octopus.AI -
Generative AI
Execute full-scope branding, including logo design, visual identity, website and platform design for Aquabble, a company leveraging the Internet of Water (IOW) to enable efficient water management. The project began after the company name "Aquabble" was already finalized by the stakeholder.
Client
Aquabble
Services
Brand Identity Design
Website Design
UI/UX Design
Roles
Rahul Choudhary - Project Lead
Jeff Davis - Brand/Visual Lead
Abhiram Sudhir - UX Designer
Date
Jan - Sep 2024
Project Understanding & Goals
Conducted comprehensive stakeholder interviews to grasp Aquabble's vision and objectives.
Clearly outlined branding and website goals -
Establish a memorable brand identity reflecting sustainability.
Create a compelling brand name resonating with technology and water management.
Design a user-friendly, mission-aligned website.
We conducted in-depth stakeholder interviews to understand Aquabble's vision and objectives. Based on these insights, we defined clear goals for the branding and website: to establish a memorable identity that reflects sustainability, craft a compelling name that resonates with technology and water management, and design a user-friendly website aligned with the brand’s mission.
We conducted in-depth stakeholder interviews to understand Aquabble's vision and objectives. Based on these insights, we defined clear goals for the branding and website: to establish a memorable identity that reflects sustainability, craft a compelling name that resonates with technology and water management, and design a user-friendly website aligned with the brand’s mission.

Challenges
Educating users about the complex concept of the Internet of Water (IOW). Building user trust in a completely new brand in a sensitive sector like water conservation. Designing for a wide variety of user personas including researchers, residents, government bodies, and NGOs. Lack of awareness or incentives to act on personal water usage.
Solution
Created visually engaging explainers, infographics, and animations to simplify the concept and integrate them seamlessly within the brand story and platform walkthroughs. Developed a transparent brand voice and incorporated real time data dashboards to enhance credibility. Supported this with consistent UX messaging and community testimonials. Adopted a modular design system with customizable UI elements, ensuring each user could access tailored content and tools relevant to their role. Introduced gamified elements and local benchmarks to drive engagement and encourage behavioural change at individual and community levels.
Competitive Analysis
To position Aquabble effectively in the market, we conducted a competitive analysis of key players in the water management space. This helped identify gaps in user experience, platform focus, and engagement strategies, highlighting clear opportunities for Aquabble to stand out with its dual B2C and B2B/B2G approach, interactive storytelling, and real-time gamified data experiences.
To position Aquabble effectively in the market, we conducted a competitive analysis of key players in the water management space. This helped identify gaps in user experience, platform focus, and engagement strategies, highlighting clear opportunities for Aquabble to stand out with its dual B2C and B2B/B2G approach, interactive storytelling, and real-time gamified data experiences.
Competitor
UX Strengths
UX Weaknesses
SmartWater
Strong IoT integrations, real time alerts
Limited user segmentation, lack of gamification
Dropcountr
Competitor
Utility based tracking, clean dashboards
Strengths
Focused only on North American utilities
Weaknesses
Zoho Books
Extensive integrations, customizable
Complex interface, steep learning curve
WaterSmart
Analytics heavy, data driven
Not visually appealing or user first in design
EcoWater
Household product integration
No civic or city-level platform offering
Local NGOs
Strong grassroots presence, community voice
Lack digital interfaces, limited scale
What we found
Insights
Our competitive analysis revealed that while existing platforms offer strong technical capabilities, like IoT integration or analytics, most fall short in user centric design, engagement, and scalability across different user groups. These gaps shaped Aquabble’s unique positioning. We focused on delivering an inclusive, visually engaging platform that simplifies complex data, supports both grassroots and institutional users, and drives behavioral change through gamification. The ability to serve both B2C and B2B/B2G users, coupled with real time dashboards and tailored user journeys, emerged as a key differentiator that sets Aquabble apart in the evolving water management landscape.

S.W.C.D.UX.O Analysis
Strengths
Weaknesses
Challenges
Desires
UX Opportunities
Sustainability first mission
Limited brand recall
Educating users about IOW
Clear brand voice
Story driven visuals
Tech driven innovation
Lack of existing user trust
Creating engagement with B2B & B2C
Engaging web experience
AI enhanced learning tools
Eco focus + scalability
Unclear visual tone
Explaining the IOW concept clearly
Interactive education
Explainer animations
Early mover advantage
No brand presence in Bengaluru
Building trust through design
Community building
Personalised user dashboards
Research backed solutions
Inconsistent water terminology
Aligning messaging with regulations
Real world case studies
Timeline/Impact visualisations
Local team in India
Language barriers in communication
Regional brand perception
Localised interfaces
Multilingual interface
Cross-industry potential
No established design language
Cross-sector usability
Simplicity
Universal design pattern library
High utility product
Weak content strategy
Discoverability
Search engine optimised content
Predictive search & categorisation
Tech savvy early adopters
Lack of support materials
Learning curve
Guided onboarding
Chatbots, live tutorials
Aligned with UN sustainability
Absence of user metrics dashboard
Building credibility fast
Data-backed storytelling
Impact meters and reports
The primary user stories highlight the diverse needs of key stakeholders interacting with Octopus.AI. Product designers seek fast, AI-assisted layout generation to streamline ideation, while developers prioritise clean and reliable code outputs to minimise debugging. End users value having control over AI outputs to build trust and confidence in the system. Project managers focus on real-time collaboration tools to oversee team workflows effectively, and accessibility advocates emphasise the importance of inclusive design that adheres to compliance standards. Together, these stories underscore the platform’s need for speed, predictability, usability, collaboration, and inclusivity.
Comprehensive Branding
& UX Development
Facilitated brand workshops (excluding naming) to define visual identity.
Designed the official Aquabble logo and visual system.
Delivered a brand book covering:
Brand voice, usage, and story
Typography, color palette
Logo applications
Visual components for scalability
Work Affinity Diagram
Cluster 1 : Brand Identity
Need a meaningful name
Visuals should evoke water and tech
Should reflect credibility
Cluster 2 : Information Design
Users want stats on water consumption
Users want personal contribution tracking
Stakeholders need investor-friendly summaries
Cluster 3 : Engagement Features
Gamification suggestions
Quiz or water footprint estimator
Testimonials to build credibility
Cluster 4 : Content & Learning
FAQs on IOW
Scientific breakdowns for researchers
Simple explainers for the general public
Cluster 5 : Localisation and Reach
Regional statistics for Bengaluru
Language accessibility
Public policy integrations
Empathy Map
The empathy map reveals that users engaging with Aquabble are curious and open-minded but often approach the platform with a degree of skepticism and a need for clarity. They seek trustworthy information, want to understand how they can contribute, and desire content that feels local and accessible, sometimes even in their regional language like Kannada.
While inspired by the concept, users often find the Internet of Water complex and want validation through data, reports, and comparisons with existing tools. Their actions, like exploring the site, sharing with peers, and clicking through detailed reports, show a mix of curiosity, cautious optimism, and a desire for tangible impact.

Use Cases
Agile User Stories
The Agile user stories highlight a diverse range of users and their specific needs from the Aquabble platform. Residents want dashboards that reflect Bengaluru’s water usage to feel more connected to the data, while apartment owners seek comparison tools to foster collective goals.
NGOs aim to embed awareness widgets on their own platforms, extending Aquabble’s visibility. Students benefit from gamified learning through quizzes and visuals, and professors need simplified explainers tailored to various age groups for better education outcomes.
CSR managers require quarterly impact metrics to align with ESG goals, whereas policy analysts rely on location-based visual trends to assess program effectiveness.
Developers look for public API access to drive innovation using IOW data, general users want zip code-specific water-saving tips for personalized action, and activists track petitions and pledges to fuel social movements and community-driven change.
Aquabble’s diverse use cases reflect its versatility across audiences, from everyday residents and students to government bodies and CSR managers. Each scenario addresses unique goals, whether it’s tracking water data, educating communities, or enabling policy transparency.
These use cases guided the platform’s modular design, ensuring personalised experiences, visual storytelling, and tools that drive awareness, collaboration, and action across Bengaluru’s civic and digital ecosystems.
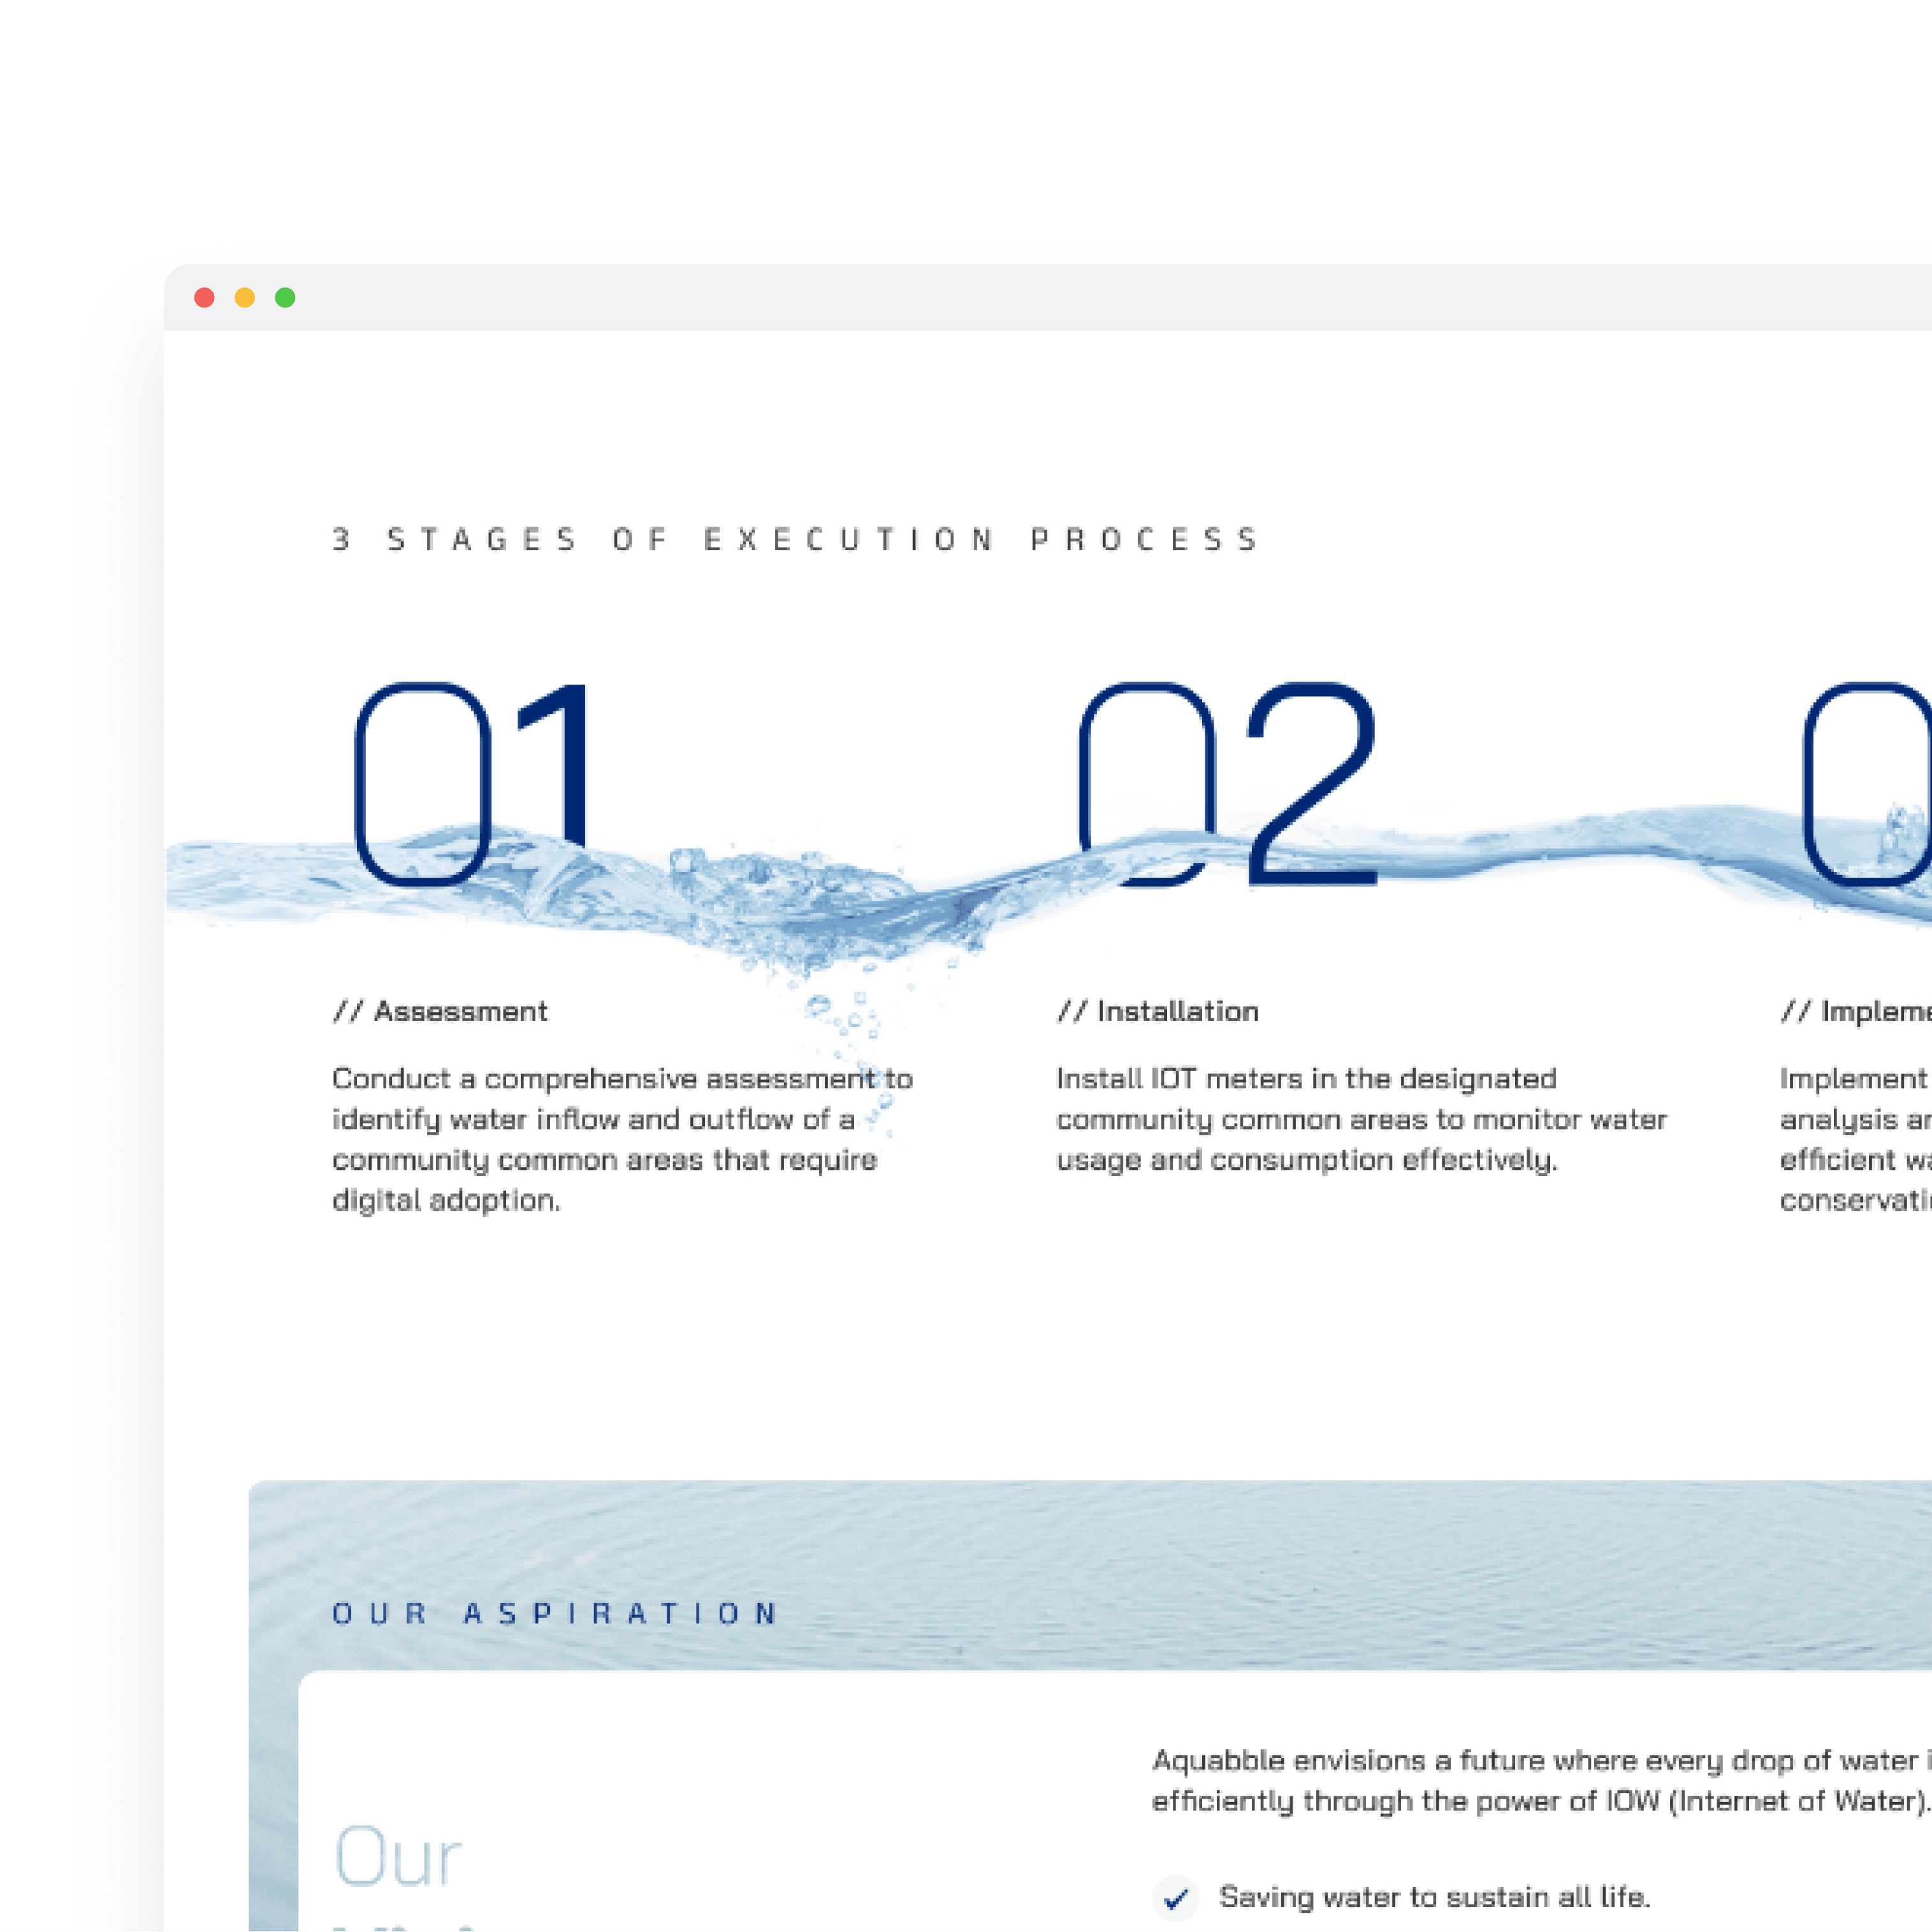
Feature Road Map (Prioritised with Real Deliverables)
The Feature Roadmap for Aquabble was carefully prioritized to balance brand development, user engagement, and technical infrastructure. In the early phase (Week 3), we focused on Brand Name Creation through structured naming workshops, domain availability checks, and stakeholder inputs. This was followed closely by the development of the Logo and Visual Identity, finalized through rapid design sprints and approvals. By Week 4, a comprehensive Brand Book covering typography, color palettes, logo usage, and tone of voice was created, alongside a Messaging Framework, an internal guide that shaped consistent storytelling and FAQ scripting across the platform.
Week 5 introduced our first major platform deliverables. We launched a Homepage Design that clearly outlined Aquabble’s mission, KPIs, and calls to action. Alongside this, the Bengaluru Impact Dashboard was built to display real-time, localized water metrics. To aid understanding of the Internet of Water (IOW), Week 6 saw the development of an IOW Visual Explainer in animated form, supplemented by a Technical Resources Library containing PDFs, whitepapers, and videos. Mobile readiness was also ensured during this phase through full Mobile Optimization.
Week 7 focused on interactivity and personalization. A Water-Saving Calculator offered user-specific tips through dynamic inputs, while a Quiz Engine allowed students and learners to engage with gamified content powered by backend logic. Week 8 introduced tools for NGOs and B2B partners, including a Data Export Tool (supporting CSV, PDF, and JSON formats), an embeddable Widget Generator, a Testimonial Carousel showcasing rotating partner feedback, and a Language Toggle supporting English and Kannada to localize accessibility.
In the final phase, Weeks 9 to 10, we rolled out system-wide enhancements. These included a Search + Filtering Engine for better discoverability, an AI-powered Contact/Inquiry Bot to assist users, and a CMS-enabled Event/Partner Showcase Page highlighting NGO and government collaborations. To scale brand visibility, we introduced a Brand Awareness Toolkit, downloadable assets for external stakeholders. Finally, a Feedback + Rating System was deployed to capture in-site reviews and support ongoing improvements through analytics.
Each deliverable was strategically timed to build momentum across user types while supporting a scalable, transparent, and impact driven digital experience.
Comprehensive Branding
& UX Development
Facilitated branding workshops to align name, story, and visual tone.
Created and delivered a detailed brand book including :
Brand narrative and voice
Logo usage guide
Typography and colour systems
Use case examples and scalable design patterns
Designed interactive, modular website wireframes tailored for multi user journeys.
Key Differentiators for Aquabble
Platform designed for both B2C (residents) and B2B/B2G (government, NGOs) users.
Custom storytelling and explainers to demystify water data.
Real-time community data + gamification = engagement and impact.
Information Architecture
Home
Hero Section: Tagline, Call-to-Action (e.g., “Explore Water Data Now”)
Quick Stats: Real-time Water Index Snapshot
Featured Story: Explainer or Community Highlight
User Type Selector (Resident | Researcher | Partner)
Our Mission
The Internet of Water Explained
Our Story
Our Partners
Team & Advisors
Water Index
City Overview (e.g., Bengaluru)
Neighborhood Dashboard
Weekly Trends & Historical Data
Impact Meters (Community Usage vs Benchmarks)
Data Methodology & Sources
Learn
Explainers (e.g., What is IOW?)
Infographics & Animations
Educational Toolkits (For Schools, NGOs)
Case Studies
Glossary of Water Terms
Act
Save Water at Home (Tips, Tools)
Gamified Challenges (Individual/Community)
Leaderboards & Badges
Community Stories
Partner Campaigns
For NGOs
For Government
For CSR & Enterprises
Co-Branding Opportunities
Request a Demo / Consultation
Resources
Blog & Insights
Reports & Whitepapers
Media & Press
Downloads (Toolkits, Reports, etc.)
Dashboard (Personalised, Login Required)
User Profile
Household Water Usage Tracker
Alerts & Goals
Saved Reports
Custom Data Exports
Support
Submit Feedback
Live Chat / Chatbot
FAQ
Help Center
Contact Us
Privacy Policy
Terms of Use
Accessibility Statement
Cookie Settings
Branding
High Fidelity


Reflecting & Evolvution
Ethical and Inclusive AI Implementation
Ensured AI transparency by clearly indicating AI generated UI elements.
Implemented strict guidelines to prevent biases in UI/UX designs.
Conducted rigorous accessibility testing adhering to WCAG 2.1 standards to ensure inclusivity.
Established user control protocols, enabling manual overrides on AI-generated designs.
Setup for AI Training Handoff
Prepared extensive documentation for training and fine tuning AI models, including interaction patterns, best practices, and troubleshooting guides.
Developed interactive, step by step tutorials for developers and stakeholders.
Provided detailed guidelines on ethical considerations and inclusivity in AI-driven design.
Retrospection and Continuous Improvement
Conducted comprehensive retrospection involving stakeholders, designers, developers, and users to evaluate project effectiveness and identify improvement areas.
Analysed and documented AI performance, comparing human designed interfaces with AI generated outputs.
Created a continuous improvement roadmap highlighting ongoing enhancements in AI capabilities, user experience optimisation, and ethical AI practices.
Planned future iterations emphasising user feedback, technological advancements, and ethical standards maintenance.

Extensive Usability Testing
To ensure Aquabble’s platform was intuitive and inclusive, we conducted extensive usability testing across various user roles. The sessions revealed key friction points, from unclear navigation and overly technical language to hidden features and low engagement with content-heavy sections.
These insights directly informed design improvements such as streamlined menus, visual storytelling, enhanced localisation, and more flexible feedback tools, resulting in a more accessible and engaging user experience for both civic and professional users.

Work Affinity Diagram
S.W.C.D.UX.O Analysis
Work Affinity Diagram
Cluster 1 : Brand Identity
Need a meaningful name
Visuals should evoke water and tech
Should reflect credibility
Cluster 2 : Information Design
Users want stats on water consumption
Users want personal contribution tracking
Stakeholders need investor-friendly summaries
Cluster 3 : Engagement Features
Gamification suggestions
Quiz or water footprint estimator
Testimonials to build credibility
The S.W.C.D.UX.O analysis uncovered key factors shaping Aquabble’s strategy, from its strengths in sustainability and innovation to challenges like limited brand recall and communication barriers. By identifying user desires and UX opportunities, we focused on building a platform that is not only informative and intuitive but also scalable, localised, and trust-driven.
Cluster 4 : Content & Learning
FAQs on IOW
Scientific breakdowns for researchers
Simple explainers for the general public
Cluster 5 : Localisation and Reach
Regional statistics for Bengaluru
Language accessibility
Public policy integrations
This analysis guided us in designing personalised, engaging experiences that simplify complex concepts like the Internet of Water while aligning with regional needs and global sustainability goals.
Empathy Map
Says
Thinks
Does
Feels
“What is the Internet of Water?”
"Is this data trustworthy?"
Searches for articles and videos
Curious, skeptical
“How can I contribute to water saving?”
“It sounds complicated but important”
Visits website, shares with peers
Inspired, but unsure
“I want to see Bengaluru’s performance”
“I wish this was in Kannada”
Navigates to local insights section
Confident, connected
“How is this different from other tools?”
“Will this scale beyond just an idea?”
Compares with other water-tech sites
Analytical, pragmatic
“This is cool but is it legit?”
“Can I verify these claims myself?”
Clicks on reports, contact info
Cautiously optimistic
Use Cases
ID
Role
Scenario
Goals
01
Local Resident
Wants to track Bengaluru’s water index weekly
Gain awareness + share with peers
02
Research Analyst
Needs structured, exportable data on IOW outcomes
Data driven reporting
03
Urban Planner
Understands regional water flow trends
Urban infrastructure improvement
04
Educator
Teaching students about smart water use
Visual explainers and activities
05
Government Partner
Needs a credible platform to showcase public programs
Support transparency + digital governance
06
CSR Manager
Explore local engagement partnerships in Bengaluru
ROI & sustainability alignment
07
Social Influencer
Wants to create content on eco-living
Quick facts + compelling visuals
08
NGO Worker
Looking for collaboration tools for campaigns
Co branded awareness campaigns
09
School Student
Learning about climate action
Gamified water saving journey
10
Apartment Owner
Compare household usage to neighborhood average
Encourage collective action
Aquabble’s diverse use cases reflect its versatility across audiences, from everyday residents and students to government bodies and CSR managers. Each scenario addresses unique goals, whether it’s tracking water data, educating communities, or enabling policy transparency. These use cases guided the platform’s modular design, ensuring personalised experiences, visual storytelling, and tools that drive awareness, collaboration, and action across Bengaluru’s civic and digital ecosystems.
Agile User Stories
ID
Role
User Story
Benefit
01
Resident
As a resident, I want a dashboard showing Bengaluru’s water consumption
Increases personal connection to data
02
NGO Partner
As an NGO, I want to embed widgets in my site to raise awareness
Extends platform visibility
03
Student
As a student, I want to learn through quizzes and visuals
Enhances understanding through gamification
04
CSR Manager
As a company rep, I want impact metrics I can report quarterly
Aligns with internal ESG goals
05
Professor
As a teacher, I want simplified explainers for different age groups
Supports better education outcomes
06
Developer
As a developer, I want public API access to build apps using IOW data
Encourages open innovation
07
Policy Analyst
As an analyst, I want trend visualizations filtered by location
Facilitates policy impact assessments
08
General User
As a user, I want water-saving tips delivered based on my zip code
Personalizes content and encourages action
09
Activist
As an activist, I want to track petitions and user pledges
Builds community and social pressure
10
Apartment Owner
As a resident, I want to compare usage with others nearby
Fosters competition and community goals
Feature Road Map (Prioritized with Real Deliverables)
Priority
Feature
Description
Timeline
01
Brand Name Creation
Naming workshop, ideation, domain availability testing
Week 3
02
Logo + Visual Identity
Design sprints + stakeholder approvals
Week 3
03
Brand Book
Typography, colors, logo rules, tone of voice
Week 4
04
Messaging Framework
Internal guide for brand story + FAQ script
Week 4
05
Homepage Design
Landing with mission, KPIs, CTA
Week 5
06
Bengaluru Impact Dashboard
City specific, localised water metrics
Week 5
07
IOW Visual Explainer
Storyboard + animation
Week 6
08
Technical Resources Library
PDFs, videos, white papers
Week 6
09
Mobile Optimisation
Responsive design across devices
Week 6
10
Water Saving Calculator
Dynamic form with input-based recommendations
Week 7
11
Quiz Engine
Educational module with backend score logic
Week 7
12
Data Export Tool
CSV, PDF, JSON formats
Week 8
13
Widget Generator
NGOs and partners can embed outreach tools
Week 8
14
Testimonial Carousel
Rotating partner feedback
Week 8
15
Language Toggle (EN/KA)
Kannada and English language switch
Week 8
16
Search + Filtering Engine
Site wide dynamic filtering
Week 9
17
Contact/Inquiry Bot
AI based chatbot integration
Week 9
18
Event/Partner Showcase Page
CMS integrated page for NGO + Govt alliances
Week 9
19
Brand Awareness Toolkit
Downloadable branding assets for partners
Week 10
20
Feedback + Rating System
In site feedback capture with analytics
Week 10
Comprehensive Branding
& UX Development
Facilitated branding workshops to align name, story, and visual tone.
Created and delivered a detailed brand book including :
Brand narrative and voice
Logo usage guide
Typography and colour systems
Use case examples and scalable design patterns
Designed interactive, modular website wireframes tailored for multi user journeys.
Extensive Usability Testing
Test Scenario
Test Method
Participant Role
Issues Found
Improvements Made
Website navigation efficiency
Task based
General User
Confusing menu structure
Simplified navigation
Dashboard interaction
Scenario
Local Resident
Too much technical language
Added glossary, tooltips
Brand story engagement
A/B Testing
CSR Manager
One version too text-heavy
Visual first redesign
Localization toggle clarity
Task based
Researcher
Not easily visible
Promoted visibility at top nav
Feedback tool
Roleplay
NGO Partner
Lacked structure
Added custom topic options
To ensure Aquabble’s platform was intuitive and inclusive, we conducted extensive usability testing across various user roles. The sessions revealed key friction points, from unclear navigation and overly technical language to hidden features and low engagement with content-heavy sections. These insights directly informed design improvements such as streamlined menus, visual storytelling, enhanced localisation, and more flexible feedback tools, resulting in a more accessible and engaging user experience for both civic and professional users.
Key Differentiators for Aquabble
Platform designed for both B2C (residents) and B2B/B2G (government, NGOs) users.
Custom storytelling and explainers to demystify water data.
Real-time community data + gamification = engagement and impact.
Information Architecture
Home
Hero Section: Tagline, Call-to-Action (e.g., “Explore Water Data Now”)
Quick Stats: Real-time Water Index Snapshot
Featured Story: Explainer or Community Highlight
User Type Selector (Resident | Researcher | Partner)
Our Mission
The Internet of Water Explained
Our Story
Our Partners
Team & Advisors
Water Index
City Overview (e.g., Bengaluru)
Neighborhood Dashboard
Weekly Trends & Historical Data
Impact Meters (Community Usage vs Benchmarks)
Data Methodology & Sources
Learn
Explainers (e.g., What is IOW?)
Infographics & Animations
Educational Toolkits (For Schools, NGOs)
Case Studies
Glossary of Water Terms
Act
Save Water at Home (Tips, Tools)
Gamified Challenges (Individual/Community)
Leaderboards & Badges
Community Stories
Partner Campaigns
For NGOs
For Government
For CSR & Enterprises
Co-Branding Opportunities
Request a Demo / Consultation
Resources
Blog & Insights
Reports & Whitepapers
Media & Press
Downloads (Toolkits, Reports, etc.)
Dashboard (Personalised, Login Required)
User Profile
Household Water Usage Tracker
Alerts & Goals
Saved Reports
Custom Data Exports
Support
Submit Feedback
Live Chat / Chatbot
FAQ
Help Center
Contact Us
Privacy Policy
Terms of Use
Accessibility Statement
Cookie Settings
Branding
Branding
High Fidelity
High Fidelity
Reflecting & Evolvution
Reflecting & Evolvution
Ethical and Inclusive UX Implementation -
Ensured full WCAG 2.1 accessibility compliance (color contrast, screen reader, keyboard navigation).
Prioritized transparency in all Internet of Water (IOW) data displays.
Conducted inclusive usability testing with five demographic groups across Bengaluru.
Branding : Reflect & Evolve -
Refined brand narrative to reflect community impact and user insights.
Updated visual identity to emphasize approachability and sustainability.
Revised brand guidelines for scalability across digital, civic, and social platforms.
Setup for Handoff -
Created editable design and content templates for internal teams.
Conducted hands-on training sessions covering branding, web, and content updates.
Transferred platform control through secure admin access and Git-based documentation.
Retrospection and Continuous Improvement -
Facilitated structured retrospective workshops with team and stakeholders.
Identified 8 key wins and 5 areas for improvement.
Developed a Q2–Q4 product roadmap informed by analytics and feedback.
Established baseline performance metrics for post-launch tracking and iteration.
Your Next Step Starts Here
Got a bold idea or a tricky problem? We’re here to help. We work with individuals, startups, and businesses to design solutions that matter. Let’s team up and build something great together.
Your Next Step Starts Here
Got a bold idea or a tricky problem? We’re here to help. We work with individuals, startups, and businesses to design solutions that matter. Let’s team up and build something great together.
Your Next Step Starts Here
Got a bold idea or a tricky problem? We’re here to help. We work with individuals, startups, and businesses to design solutions that matter. Let’s team up and build something great together.
Aquabble - IOW (Internet of Water)
Aquabble - IOW (Internet of Water)
Octopus.AI -
Generative AI
Execute full-scope branding, including logo design, visual identity, website and platform design for Aquabble, a company leveraging the Internet of Water (IOW) to enable efficient water management. The project began after the company name "Aquabble" was already finalized by the stakeholder.
Client
Aquabble
Services
Brand Identity Design
Website Design
UI/UX Design
Roles
Rahul Choudhary - Project Lead
Jeff Davis - Brand/Visual Lead
Abhiram Sudhir - UX Designer
Date
Jan - Sep 2024
Project Understanding & Goals
Conducted comprehensive stakeholder interviews to grasp Aquabble's vision and objectives.
Clearly outlined branding and website goals -
Establish a memorable brand identity reflecting sustainability.
Create a compelling brand name resonating with technology and water management.
Design a user-friendly, mission-aligned website.
We conducted in-depth stakeholder interviews to understand Aquabble's vision and objectives. Based on these insights, we defined clear goals for the branding and website: to establish a memorable identity that reflects sustainability, craft a compelling name that resonates with technology and water management, and design a user-friendly website aligned with the brand’s mission.
We conducted in-depth stakeholder interviews to understand Aquabble's vision and objectives. Based on these insights, we defined clear goals for the branding and website: to establish a memorable identity that reflects sustainability, craft a compelling name that resonates with technology and water management, and design a user-friendly website aligned with the brand’s mission.
Challenges
Educating users about the complex concept of the Internet of Water (IOW). Building user trust in a completely new brand in a sensitive sector like water conservation. Designing for a wide variety of user personas including researchers, residents, government bodies, and NGOs. Lack of awareness or incentives to act on personal water usage.
Solution
Created visually engaging explainers, infographics, and animations to simplify the concept and integrate them seamlessly within the brand story and platform walkthroughs. Developed a transparent brand voice and incorporated real time data dashboards to enhance credibility. Supported this with consistent UX messaging and community testimonials. Adopted a modular design system with customizable UI elements, ensuring each user could access tailored content and tools relevant to their role. Introduced gamified elements and local benchmarks to drive engagement and encourage behavioural change at individual and community levels.
Competitive Analysis
To position Aquabble effectively in the market, we conducted a competitive analysis of key players in the water management space. This helped identify gaps in user experience, platform focus, and engagement strategies, highlighting clear opportunities for Aquabble to stand out with its dual B2C and B2B/B2G approach, interactive storytelling, and real-time gamified data experiences.
To position Aquabble effectively in the market, we conducted a competitive analysis of key players in the water management space. This helped identify gaps in user experience, platform focus, and engagement strategies, highlighting clear opportunities for Aquabble to stand out with its dual B2C and B2B/B2G approach, interactive storytelling, and real-time gamified data experiences.
Competitor
UX Strengths
UX Weaknesses
SmartWater
Strong IoT integrations, real time alerts
Limited user segmentation, lack of gamification
Dropcountr
Competitor
Utility based tracking, clean dashboards
Strengths
Focused only on North American utilities
Weaknesses
Zoho Books
Extensive integrations, customizable
Complex interface, steep learning curve
WaterSmart
Analytics heavy, data driven
Not visually appealing or user first in design
EcoWater
Household product integration
No civic or city-level platform offering
Local NGOs
Strong grassroots presence, community voice
Lack digital interfaces, limited scale
What we found
Insights
Our competitive analysis revealed that while existing platforms offer strong technical capabilities, like IoT integration or analytics, most fall short in user centric design, engagement, and scalability across different user groups. These gaps shaped Aquabble’s unique positioning. We focused on delivering an inclusive, visually engaging platform that simplifies complex data, supports both grassroots and institutional users, and drives behavioral change through gamification. The ability to serve both B2C and B2B/B2G users, coupled with real time dashboards and tailored user journeys, emerged as a key differentiator that sets Aquabble apart in the evolving water management landscape.
S.W.C.D.UX.O Analysis
Strengths
Weaknesses
Challenges
Desires
UX Opportunities
Sustainability first mission
Limited brand recall
Educating users about IOW
Clear brand voice
Story driven visuals
Tech driven innovation
Lack of existing user trust
Creating engagement with B2B & B2C
Engaging web experience
AI enhanced learning tools
Eco focus + scalability
Unclear visual tone
Explaining the IOW concept clearly
Interactive education
Explainer animations
Early mover advantage
No brand presence in Bengaluru
Building trust through design
Community building
Personalised user dashboards
Research backed solutions
Inconsistent water terminology
Aligning messaging with regulations
Real world case studies
Timeline/Impact visualisations
Local team in India
Language barriers in communication
Regional brand perception
Localised interfaces
Multilingual interface
Cross-industry potential
No established design language
Cross-sector usability
Simplicity
Universal design pattern library
High utility product
Weak content strategy
Discoverability
Search engine optimised content
Predictive search & categorisation
Tech savvy early adopters
Lack of support materials
Learning curve
Guided onboarding
Chatbots, live tutorials
Aligned with UN sustainability
Absence of user metrics dashboard
Building credibility fast
Data-backed storytelling
Impact meters and reports
The primary user stories highlight the diverse needs of key stakeholders interacting with Octopus.AI. Product designers seek fast, AI-assisted layout generation to streamline ideation, while developers prioritise clean and reliable code outputs to minimise debugging. End users value having control over AI outputs to build trust and confidence in the system. Project managers focus on real-time collaboration tools to oversee team workflows effectively, and accessibility advocates emphasise the importance of inclusive design that adheres to compliance standards. Together, these stories underscore the platform’s need for speed, predictability, usability, collaboration, and inclusivity.
Comprehensive Branding
& UX Development
Facilitated brand workshops (excluding naming) to define visual identity.
Designed the official Aquabble logo and visual system.
Delivered a brand book covering:
Brand voice, usage, and story
Typography, color palette
Logo applications
Visual components for scalability
Comprehensive Branding
& UX Development
Facilitated brand workshops (excluding naming) to define visual identity.
Designed the official Aquabble logo and visual system.
Delivered a brand book covering:
Brand voice, usage, and story
Typography, color palette
Logo applications
Visual components for scalability
Work Affinity Diagram
Cluster 1 : Brand Identity
Need a meaningful name
Visuals should evoke water and tech
Should reflect credibility
Cluster 2 : Information Design
Users want stats on water consumption
Users want personal contribution tracking
Stakeholders need investor-friendly summaries
Cluster 3 : Engagement Features
Gamification suggestions
Quiz or water footprint estimator
Testimonials to build credibility
Cluster 4 : Content & Learning
FAQs on IOW
Scientific breakdowns for researchers
Simple explainers for the general public
Cluster 5 : Localisation and Reach
Regional statistics for Bengaluru
Language accessibility
Public policy integrations
Empathy Map
The empathy map reveals that users engaging with Aquabble are curious and open-minded but often approach the platform with a degree of skepticism and a need for clarity. They seek trustworthy information, want to understand how they can contribute, and desire content that feels local and accessible, sometimes even in their regional language like Kannada.
While inspired by the concept, users often find the Internet of Water complex and want validation through data, reports, and comparisons with existing tools. Their actions, like exploring the site, sharing with peers, and clicking through detailed reports, show a mix of curiosity, cautious optimism, and a desire for tangible impact.
Use Cases
Agile User Stories
The Agile user stories highlight a diverse range of users and their specific needs from the Aquabble platform. Residents want dashboards that reflect Bengaluru’s water usage to feel more connected to the data, while apartment owners seek comparison tools to foster collective goals.
NGOs aim to embed awareness widgets on their own platforms, extending Aquabble’s visibility. Students benefit from gamified learning through quizzes and visuals, and professors need simplified explainers tailored to various age groups for better education outcomes.
CSR managers require quarterly impact metrics to align with ESG goals, whereas policy analysts rely on location-based visual trends to assess program effectiveness.
Developers look for public API access to drive innovation using IOW data, general users want zip code-specific water-saving tips for personalized action, and activists track petitions and pledges to fuel social movements and community-driven change.
Aquabble’s diverse use cases reflect its versatility across audiences, from everyday residents and students to government bodies and CSR managers. Each scenario addresses unique goals, whether it’s tracking water data, educating communities, or enabling policy transparency.
These use cases guided the platform’s modular design, ensuring personalised experiences, visual storytelling, and tools that drive awareness, collaboration, and action across Bengaluru’s civic and digital ecosystems.
Feature Road Map (Prioritised with Real Deliverables)
The Feature Roadmap for Aquabble was carefully prioritized to balance brand development, user engagement, and technical infrastructure. In the early phase (Week 3), we focused on Brand Name Creation through structured naming workshops, domain availability checks, and stakeholder inputs. This was followed closely by the development of the Logo and Visual Identity, finalized through rapid design sprints and approvals. By Week 4, a comprehensive Brand Book covering typography, color palettes, logo usage, and tone of voice was created, alongside a Messaging Framework, an internal guide that shaped consistent storytelling and FAQ scripting across the platform.
Week 5 introduced our first major platform deliverables. We launched a Homepage Design that clearly outlined Aquabble’s mission, KPIs, and calls to action. Alongside this, the Bengaluru Impact Dashboard was built to display real-time, localized water metrics. To aid understanding of the Internet of Water (IOW), Week 6 saw the development of an IOW Visual Explainer in animated form, supplemented by a Technical Resources Library containing PDFs, whitepapers, and videos. Mobile readiness was also ensured during this phase through full Mobile Optimization.
Week 7 focused on interactivity and personalization. A Water-Saving Calculator offered user-specific tips through dynamic inputs, while a Quiz Engine allowed students and learners to engage with gamified content powered by backend logic. Week 8 introduced tools for NGOs and B2B partners, including a Data Export Tool (supporting CSV, PDF, and JSON formats), an embeddable Widget Generator, a Testimonial Carousel showcasing rotating partner feedback, and a Language Toggle supporting English and Kannada to localize accessibility.
In the final phase, Weeks 9 to 10, we rolled out system-wide enhancements. These included a Search + Filtering Engine for better discoverability, an AI-powered Contact/Inquiry Bot to assist users, and a CMS-enabled Event/Partner Showcase Page highlighting NGO and government collaborations. To scale brand visibility, we introduced a Brand Awareness Toolkit, downloadable assets for external stakeholders. Finally, a Feedback + Rating System was deployed to capture in-site reviews and support ongoing improvements through analytics.
Each deliverable was strategically timed to build momentum across user types while supporting a scalable, transparent, and impact driven digital experience.
Comprehensive Branding
& UX Development
Facilitated branding workshops to align name, story, and visual tone.
Created and delivered a detailed brand book including :
Brand narrative and voice
Logo usage guide
Typography and colour systems
Use case examples and scalable design patterns
Designed interactive, modular website wireframes tailored for multi user journeys.
Key Differentiators for Aquabble
Platform designed for both B2C (residents) and B2B/B2G (government, NGOs) users.
Custom storytelling and explainers to demystify water data.
Real-time community data + gamification = engagement and impact.
Information Architecture
Home
Hero Section: Tagline, Call-to-Action (e.g., “Explore Water Data Now”)
Quick Stats: Real-time Water Index Snapshot
Featured Story: Explainer or Community Highlight
User Type Selector (Resident | Researcher | Partner)
Our Mission
The Internet of Water Explained
Our Story
Our Partners
Team & Advisors
Water Index
City Overview (e.g., Bengaluru)
Neighborhood Dashboard
Weekly Trends & Historical Data
Impact Meters (Community Usage vs Benchmarks)
Data Methodology & Sources
Learn
Explainers (e.g., What is IOW?)
Infographics & Animations
Educational Toolkits (For Schools, NGOs)
Case Studies
Glossary of Water Terms
Act
Save Water at Home (Tips, Tools)
Gamified Challenges (Individual/Community)
Leaderboards & Badges
Community Stories
Partner Campaigns
For NGOs
For Government
For CSR & Enterprises
Co-Branding Opportunities
Request a Demo / Consultation
Resources
Blog & Insights
Reports & Whitepapers
Media & Press
Downloads (Toolkits, Reports, etc.)
Dashboard (Personalised, Login Required)
User Profile
Household Water Usage Tracker
Alerts & Goals
Saved Reports
Custom Data Exports
Support
Submit Feedback
Live Chat / Chatbot
FAQ
Help Center
Contact Us
Privacy Policy
Terms of Use
Accessibility Statement
Cookie Settings
Branding
High Fidelity
Reflecting & Evolvution
Ethical and Inclusive AI Implementation
Ensured AI transparency by clearly indicating AI generated UI elements.
Implemented strict guidelines to prevent biases in UI/UX designs.
Conducted rigorous accessibility testing adhering to WCAG 2.1 standards to ensure inclusivity.
Established user control protocols, enabling manual overrides on AI-generated designs.
Setup for AI Training Handoff
Prepared extensive documentation for training and fine tuning AI models, including interaction patterns, best practices, and troubleshooting guides.
Developed interactive, step by step tutorials for developers and stakeholders.
Provided detailed guidelines on ethical considerations and inclusivity in AI-driven design.
Retrospection and Continuous Improvement
Conducted comprehensive retrospection involving stakeholders, designers, developers, and users to evaluate project effectiveness and identify improvement areas.
Analysed and documented AI performance, comparing human designed interfaces with AI generated outputs.
Created a continuous improvement roadmap highlighting ongoing enhancements in AI capabilities, user experience optimisation, and ethical AI practices.
Planned future iterations emphasising user feedback, technological advancements, and ethical standards maintenance.
Extensive Usability Testing
To ensure Aquabble’s platform was intuitive and inclusive, we conducted extensive usability testing across various user roles. The sessions revealed key friction points, from unclear navigation and overly technical language to hidden features and low engagement with content-heavy sections.
These insights directly informed design improvements such as streamlined menus, visual storytelling, enhanced localisation, and more flexible feedback tools, resulting in a more accessible and engaging user experience for both civic and professional users.
Work Affinity Diagram
S.W.C.D.UX.O Analysis
Work Affinity Diagram
Cluster 1 : Brand Identity
Need a meaningful name
Visuals should evoke water and tech
Should reflect credibility
Cluster 2 : Information Design
Users want stats on water consumption
Users want personal contribution tracking
Stakeholders need investor-friendly summaries
Cluster 3 : Engagement Features
Gamification suggestions
Quiz or water footprint estimator
Testimonials to build credibility
The S.W.C.D.UX.O analysis uncovered key factors shaping Aquabble’s strategy, from its strengths in sustainability and innovation to challenges like limited brand recall and communication barriers. By identifying user desires and UX opportunities, we focused on building a platform that is not only informative and intuitive but also scalable, localised, and trust-driven.
Cluster 4 : Content & Learning
FAQs on IOW
Scientific breakdowns for researchers
Simple explainers for the general public
Cluster 5 : Localisation and Reach
Regional statistics for Bengaluru
Language accessibility
Public policy integrations
This analysis guided us in designing personalised, engaging experiences that simplify complex concepts like the Internet of Water while aligning with regional needs and global sustainability goals.
Empathy Map
Says
Thinks
Does
Feels
“What is the Internet of Water?”
"Is this data trustworthy?"
Searches for articles and videos
Curious, skeptical
“How can I contribute to water saving?”
“It sounds complicated but important”
Visits website, shares with peers
Inspired, but unsure
“I want to see Bengaluru’s performance”
“I wish this was in Kannada”
Navigates to local insights section
Confident, connected
“How is this different from other tools?”
“Will this scale beyond just an idea?”
Compares with other water-tech sites
Analytical, pragmatic
“This is cool but is it legit?”
“Can I verify these claims myself?”
Clicks on reports, contact info
Cautiously optimistic
Use Cases
ID
Role
Scenario
Goals
01
Local Resident
Wants to track Bengaluru’s water index weekly
Gain awareness + share with peers
02
Research Analyst
Needs structured, exportable data on IOW outcomes
Data driven reporting
03
Urban Planner
Understands regional water flow trends
Urban infrastructure improvement
04
Educator
Teaching students about smart water use
Visual explainers and activities
05
Government Partner
Needs a credible platform to showcase public programs
Support transparency + digital governance
06
CSR Manager
Explore local engagement partnerships in Bengaluru
ROI & sustainability alignment
07
Social Influencer
Wants to create content on eco-living
Quick facts + compelling visuals
08
NGO Worker
Looking for collaboration tools for campaigns
Co branded awareness campaigns
09
School Student
Learning about climate action
Gamified water saving journey
10
Apartment Owner
Compare household usage to neighborhood average
Encourage collective action
Aquabble’s diverse use cases reflect its versatility across audiences, from everyday residents and students to government bodies and CSR managers. Each scenario addresses unique goals, whether it’s tracking water data, educating communities, or enabling policy transparency. These use cases guided the platform’s modular design, ensuring personalised experiences, visual storytelling, and tools that drive awareness, collaboration, and action across Bengaluru’s civic and digital ecosystems.
Agile User Stories
ID
Role
User Story
Benefit
01
Resident
As a resident, I want a dashboard showing Bengaluru’s water consumption
Increases personal connection to data
02
NGO Partner
As an NGO, I want to embed widgets in my site to raise awareness
Extends platform visibility
03
Student
As a student, I want to learn through quizzes and visuals
Enhances understanding through gamification
04
CSR Manager
As a company rep, I want impact metrics I can report quarterly
Aligns with internal ESG goals
05
Professor
As a teacher, I want simplified explainers for different age groups
Supports better education outcomes
06
Developer
As a developer, I want public API access to build apps using IOW data
Encourages open innovation
07
Policy Analyst
As an analyst, I want trend visualizations filtered by location
Facilitates policy impact assessments
08
General User
As a user, I want water-saving tips delivered based on my zip code
Personalizes content and encourages action
09
Activist
As an activist, I want to track petitions and user pledges
Builds community and social pressure
10
Apartment Owner
As a resident, I want to compare usage with others nearby
Fosters competition and community goals
Feature Road Map (Prioritized with Real Deliverables)
Priority
Feature
Description
Timeline
01
Brand Name Creation
Naming workshop, ideation, domain availability testing
Week 3
02
Logo + Visual Identity
Design sprints + stakeholder approvals
Week 3
03
Brand Book
Typography, colors, logo rules, tone of voice
Week 4
04
Messaging Framework
Internal guide for brand story + FAQ script
Week 4
05
Homepage Design
Landing with mission, KPIs, CTA
Week 5
06
Bengaluru Impact Dashboard
City specific, localised water metrics
Week 5
07
IOW Visual Explainer
Storyboard + animation
Week 6
08
Technical Resources Library
PDFs, videos, white papers
Week 6
09
Mobile Optimisation
Responsive design across devices
Week 6
10
Water Saving Calculator
Dynamic form with input-based recommendations
Week 7
11
Quiz Engine
Educational module with backend score logic
Week 7
12
Data Export Tool
CSV, PDF, JSON formats
Week 8
13
Widget Generator
NGOs and partners can embed outreach tools
Week 8
14
Testimonial Carousel
Rotating partner feedback
Week 8
15
Language Toggle (EN/KA)
Kannada and English language switch
Week 8
16
Search + Filtering Engine
Site wide dynamic filtering
Week 9
17
Contact/Inquiry Bot
AI based chatbot integration
Week 9
18
Event/Partner Showcase Page
CMS integrated page for NGO + Govt alliances
Week 9
19
Brand Awareness Toolkit
Downloadable branding assets for partners
Week 10
20
Feedback + Rating System
In site feedback capture with analytics
Week 10
Comprehensive Branding
& UX Development
Facilitated branding workshops to align name, story, and visual tone.
Created and delivered a detailed brand book including :
Brand narrative and voice
Logo usage guide
Typography and colour systems
Use case examples and scalable design patterns
Designed interactive, modular website wireframes tailored for multi user journeys.
Extensive Usability Testing
Test Scenario
Test Method
Participant Role
Issues Found
Improvements Made
Website navigation efficiency
Task based
General User
Confusing menu structure
Simplified navigation
Dashboard interaction
Scenario
Local Resident
Too much technical language
Added glossary, tooltips
Brand story engagement
A/B Testing
CSR Manager
One version too text-heavy
Visual first redesign
Localization toggle clarity
Task based
Researcher
Not easily visible
Promoted visibility at top nav
Feedback tool
Roleplay
NGO Partner
Lacked structure
Added custom topic options
To ensure Aquabble’s platform was intuitive and inclusive, we conducted extensive usability testing across various user roles. The sessions revealed key friction points, from unclear navigation and overly technical language to hidden features and low engagement with content-heavy sections. These insights directly informed design improvements such as streamlined menus, visual storytelling, enhanced localisation, and more flexible feedback tools, resulting in a more accessible and engaging user experience for both civic and professional users.
Key Differentiators for Aquabble
Platform designed for both B2C (residents) and B2B/B2G (government, NGOs) users.
Custom storytelling and explainers to demystify water data.
Real-time community data + gamification = engagement and impact.
Information Architecture
Home
Hero Section: Tagline, Call-to-Action (e.g., “Explore Water Data Now”)
Quick Stats: Real-time Water Index Snapshot
Featured Story: Explainer or Community Highlight
User Type Selector (Resident | Researcher | Partner)
Our Mission
The Internet of Water Explained
Our Story
Our Partners
Team & Advisors
Water Index
City Overview (e.g., Bengaluru)
Neighborhood Dashboard
Weekly Trends & Historical Data
Impact Meters (Community Usage vs Benchmarks)
Data Methodology & Sources
Learn
Explainers (e.g., What is IOW?)
Infographics & Animations
Educational Toolkits (For Schools, NGOs)
Case Studies
Glossary of Water Terms
Act
Save Water at Home (Tips, Tools)
Gamified Challenges (Individual/Community)
Leaderboards & Badges
Community Stories
Partner Campaigns
For NGOs
For Government
For CSR & Enterprises
Co-Branding Opportunities
Request a Demo / Consultation
Resources
Blog & Insights
Reports & Whitepapers
Media & Press
Downloads (Toolkits, Reports, etc.)
Dashboard (Personalised, Login Required)
User Profile
Household Water Usage Tracker
Alerts & Goals
Saved Reports
Custom Data Exports
Support
Submit Feedback
Live Chat / Chatbot
FAQ
Help Center
Contact Us
Privacy Policy
Terms of Use
Accessibility Statement
Cookie Settings
Branding
Branding
High Fidelity
High Fidelity
Reflecting & Evolvution
Reflecting & Evolvution
Ethical and Inclusive UX Implementation -
Ensured full WCAG 2.1 accessibility compliance (color contrast, screen reader, keyboard navigation).
Prioritized transparency in all Internet of Water (IOW) data displays.
Conducted inclusive usability testing with five demographic groups across Bengaluru.
Branding : Reflect & Evolve -
Refined brand narrative to reflect community impact and user insights.
Updated visual identity to emphasize approachability and sustainability.
Revised brand guidelines for scalability across digital, civic, and social platforms.
Setup for Handoff -
Created editable design and content templates for internal teams.
Conducted hands-on training sessions covering branding, web, and content updates.
Transferred platform control through secure admin access and Git-based documentation.
Retrospection and Continuous Improvement -
Facilitated structured retrospective workshops with team and stakeholders.
Identified 8 key wins and 5 areas for improvement.
Developed a Q2–Q4 product roadmap informed by analytics and feedback.
Established baseline performance metrics for post-launch tracking and iteration.
Your Next Step Starts Here
Got a bold idea or a tricky problem? We’re here to help. We work with individuals, startups, and businesses to design solutions that matter. Let’s team up and build something great together.
Your Next Step Starts Here
Got a bold idea or a tricky problem? We’re here to help. We work with individuals, startups, and businesses to design solutions that matter. Let’s team up and build something great together.
Your Next Step Starts Here
Got a bold idea or a tricky problem? We’re here to help. We work with individuals, startups, and businesses to design solutions that matter. Let’s team up and build something great together.